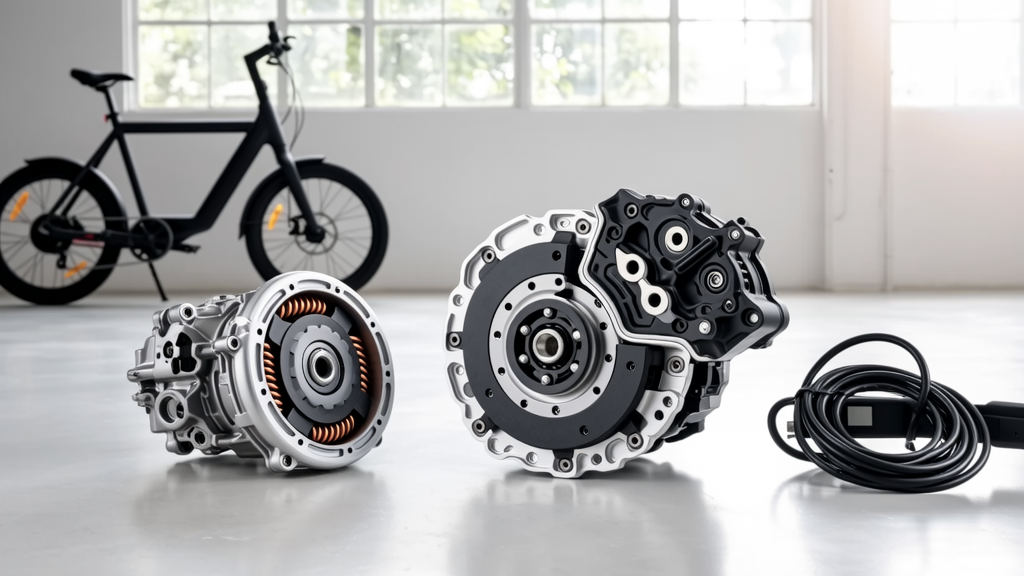
Why Rethinking Car Dependency Matters Now More Than Ever
Personal vehicle use accounts for 16% of global CO₂ emissions—and in the U.S., the average light-duty car emits 4.6 metric tons of CO₂ annually, according to the EPA’s 2023 Inventory of U.S. Greenhouse Gas Emissions. Beyond climate impact, driving contributes to urban air pollution (NOₓ and PM2.5), traffic fatalities (42,795 U.S. deaths in 2022, per NHTSA), and household financial strain: AAA reports the average annual cost of owning and operating a new sedan is $12,182—$1,015 per month. As cities implement low-emission zones, EV charging infrastructure expands, and grid decarbonization accelerates, viable, scalable alternatives are no longer theoretical. This article examines seven technically sound, widely deployed alternatives—not as niche experiments, but as engineered systems with measurable performance metrics, safety certifications, and real-world adoption rates.
Electric Bicycles: The Most Efficient Urban Mobility Tool
Electric bicycles (e-bikes) convert over 90% of grid electricity into forward motion—far exceeding internal combustion engines (20–30% efficiency) and even battery-electric cars (77% wall-to-wheel). Class 1 e-bikes (pedal-assist only, max 20 mph, <750W motor) dominate North American markets due to regulatory alignment with bicycle infrastructure. Brands like Trek (Allant+ 7, 250W Bosch Performance Line CX motor, 625 Wh battery), Specialized (Turbo Vado SL 5.0, 320 Wh battery, 20 mph assist), and Rad Power RadCity 5 Plus (750W rear-hub motor, 672 Wh battery) meet UL 2849 certification for electrical system safety—including battery management, wiring insulation, and overcurrent protection.
Infrastructure and Charging Realities
A typical 672 Wh e-bike battery draws 0.67 kWh per full charge. At the U.S. national average residential electricity rate of $0.16/kWh (EIA, April 2024), that’s $0.11 per charge—enough for 45–60 miles. Charging occurs via standard 120V outlets; no Level 2 EVSE required. Most e-bike chargers operate at 2–3A, drawing less than 360W—well within NEC Article 210.23(A)(1) limits for 15A circuits. Crucially, e-bike batteries do not require dedicated circuits, unlike EVs, making them compatible with existing residential wiring.
Safety and Regulatory Compliance
UL 2849 mandates rigorous testing: vibration resistance (10–500 Hz sweep), thermal cycling (-20°C to 60°C), and short-circuit survival without fire or explosion. All certified e-bikes include integrated Battery Management Systems (BMS) that monitor cell voltage variance (<0.05V), temperature differentials (<5°C), and state-of-charge cutoffs. In contrast, unregulated aftermarket battery kits frequently omit BMS hardware—contributing to 72% of e-bike fire incidents reported to NFPA between 2020–2023.
Shared Mobility Services: When Ownership Doesn’t Pay
Rideshare, carshare, and scooter-share services reduce vehicle miles traveled (VMT) per capita when deployed with high utilization rates. Zipcar’s 2023 fleet report shows each shared vehicle replaces 9–13 privately owned cars. Its fleet includes 2023 Toyota Prius Hybrids (48 mpg combined) and Chevrolet Bolt EVs (259-mile EPA range, 65 kWh battery). Turo’s peer-to-peer platform lists over 400,000 vehicles—including Tesla Model 3 Long Range (333-mile range, 82 kWh battery) and Ford Mustang Mach-E (312-mile range, 91 kWh battery)—with insurance and maintenance handled by host-owners.
Micromobility Sharing Networks
Lime and Bird deploy Class 2 e-scooters (max 15.5 mph, 350W motor, 36V/10.4Ah lithium-ion battery = 374 Wh capacity). Each scooter weighs 29–33 lbs and features IPX4 water resistance. Lime’s Gen 4 model uses regenerative braking that recovers up to 8% of kinetic energy during deceleration—verified by SAE J2954 testing protocols. Battery life averages 2–3 years (800–1,200 cycles) before capacity drops below 80%, consistent with IEEE 1625 standards for portable lithium systems.
Public Transit Electrification: Scaling Impact Without New Roads
Electric buses eliminate tailpipe emissions and reduce noise by 10–15 dB compared to diesel counterparts. Proterra ZX5 (320-mile range, 660 kWh battery pack) and BYD K11M (273-mile range, 549 kWh battery) operate on fixed routes with depot charging. A single Proterra bus consumes ~1.2 kWh/mile—less than half the energy per passenger-mile of an average EV carrying one person (2.7 kWh/mile). With 15–30 passengers per trip, electrified transit achieves 0.04–0.08 kWh/passenger-mile.
Charging Infrastructure Requirements
Depot charging uses 150–350 kW DC fast chargers (e.g., Siemens Sicharge D 350 kW units), installed on 480V, 3-phase, 400A service. Per NEC Article 625.41, these require ground-fault circuit interrupter (GFCI) protection rated for 6–30 mA, plus arc-fault detection per UL 1699B. Overnight charging at 50 kW (typical for overnight replenishment) draws 104A at 480V—demanding conduit sizing per NEC Table C.9 and torque-spec terminal connections (25–30 lb-ft for 4/0 AWG lugs).
Active Transportation Infrastructure: Engineering Safer Streets
Cycling and walking aren’t just alternatives—they’re the most energy-efficient human-powered transport modes. A cyclist expends ~0.03 kWh per mile; a pedestrian uses ~0.025 kWh. But safety depends on engineering, not intent. Protected bike lanes—raised, curb-separated, and ≥7 feet wide—reduce injury risk by 90% versus painted lanes (NACTO, 2022). Cities like Copenhagen install 2.5-meter-wide cycle tracks with tactile warning strips (ASTM F1637-compliant) and LED-illuminated bollards (IP67-rated, 24V DC input).
Electrical Integration in Pedestrian Zones
Barcelona’s superblocks (superilles) feature embedded induction loops (20–30 kHz frequency, 100–200 mH inductance) that detect bicycles and trigger green-wave traffic signals. These loops connect to DIN-rail mounted Siemens Desigo CC controllers operating on 24V DC power supplies compliant with IEC 61000-4-5 surge immunity (6 kV line-to-ground). Streetlights in these zones use adaptive dimming: 30% brightness at midnight, ramping to 100% at dawn—controlled via DALI-2 protocol over twisted-pair cabling (IEC 62386-102).
Home Energy Synergy: Reducing Transport Demand at the Source
Telecommuting and distributed work hubs cut transportation need at its origin. According to Global Workplace Analytics, remote workers save an average of 41.6 kg CO₂ per week—equivalent to planting 2.3 trees monthly. From an electrical standpoint, home offices add modest loads: a laptop (65W), monitor (30W), router (12W), and LED lighting (15W) total <150W continuous—well within the 1,800W capacity of a standard 15A/120V circuit (NEC 210.19(A)).
Residential Load Management
Smart panels like Span Smart Panel (UL 67-listed, 200A main, 32 circuit breakers) integrate with EV chargers and solar inverters to prioritize critical loads during grid stress. During peak demand (4–9 p.m.), it can shed non-essential circuits (e.g., HVAC auxiliary heat) while maintaining office power. This prevents overloading legacy 100A services common in homes built before 1990—where adding an EV charger (48A @ 240V = 11.5 kW) would otherwise require a service upgrade costing $2,500–$4,000.
Policy and Grid Readiness: What Makes Alternatives Scalable?
Alternatives succeed only when supported by coordinated policy and resilient infrastructure. California’s SB 210 mandates all new multifamily buildings with ≥10 units install EV-ready infrastructure (conduit, panel space, neutral conductor) for 100% of parking spaces—a requirement that also benefits e-bike charging stations. Meanwhile, the Bipartisan Infrastructure Law allocates $5 billion for zero-emission bus deployment and $2.5 billion for active transportation infrastructure grants.
Grid readiness is equally critical. A neighborhood of 50 homes adding one Level 2 EV charger each (48A @ 240V) adds 576 kW of potential load—exceeding the capacity of many 25 kVA distribution transformers (25,000 VA / 240V = 104A). However, smart charging mitigates this: ChargePoint’s Flex 200 charger communicates via OpenADR 2.0 to delay charging until off-peak hours, reducing coincident peak demand by 68% (PJM Interconnection study, 2023).
For e-bikes, scalability is simpler: A single 15A circuit can support up to eight simultaneous e-bike charges (each drawing ≤1.8A), per NEC 210.20(A) continuous load derating. That’s 120% × 1.8A = 2.16A per outlet—well below the 12A limit for a 15A circuit supplying continuous loads.
Real-world adoption reflects feasibility. In Amsterdam, 47% of all trips are made by bicycle—supported by 530 km of protected bike lanes and 35,000 secure bike parking spots at train stations. In Paris, the Vélib’ Métropole system operates 20,000 bikes across 1,400 stations, with 98% uptime verified by real-time IoT sensors monitoring battery state and lock integrity.
Cost comparisons reinforce practicality. Over five years, owning a mid-tier e-bike ($2,499) costs $3,120 total (including $120 in electricity, $500 in maintenance, and $0 depreciation—e-bikes retain ~75% resale value, per Pinkbike Market Report Q1 2024). Compare that to five years of car ownership: $60,910 (AAA data). Even factoring in occasional rideshare use ($15/week = $3,900/year), the e-bike + rideshare combo remains under $25,000—40% less than car ownership.
Energy resilience matters too. E-bike batteries can serve as backup power sources during outages. The EcoFlow Delta 2 (1024 Wh, 1800W AC output) and Jackery Explorer 2000 Pro (2160 Wh, 2400W output) use LFP (lithium iron phosphate) cells with 3,500-cycle lifespans and UL 9540A thermal propagation testing. When paired with a transfer switch (e.g., Reliance Controls Q310C, UL 1008 listed), they can power refrigerators, medical devices, and LED lighting—without requiring utility interconnection permits.
Urban planning metrics confirm viability. The Institute for Transportation & Development Policy (ITDP) defines ‘transit-oriented development’ as areas with ≥10,000 jobs/housing units per square mile, served by frequent transit (≤10-minute headways), and walkable design (≥⅔ of residents live within ½ mile of transit). Cities meeting these criteria—like Arlington County, VA (14,200 units/sq mi, Metrobus every 6 minutes) or Portland’s Pearl District (12,800 units/sq mi, streetcar every 7.5 minutes)—see 32–41% lower per-capita vehicle ownership than national averages.
Technical interoperability enables seamless transitions. The MaaS (Mobility-as-a-Service) platform Whim (operating in Helsinki and Antwerp) integrates real-time data from HSL buses, VR commuter trains, CityBike Helsinki, and Bolt rideshare—calculating optimal multimodal routes using GTFS-RT feeds and ISO/IEC 18013-5 digital driver’s licenses. Payment occurs via one subscription ($69/month for unlimited transit + 4 rideshare trips + bike rentals), processed through PCI-DSS Level 1 compliant gateways.
Finally, accessibility must be engineered, not assumed. Adaptive e-bikes like the Van Raam Balance (tadpole trike, 250W motor, 500 Wh battery, weight capacity 330 lbs) comply with ADA Standards for Accessible Design §308.3 (clear width ≥36 inches) and include hand-operated hydraulic disc brakes meeting ISO 4210-7 brake force requirements (≥150 N at lever). Charging ports are mounted at 30 inches above floor level—within ADA-recommended reach range.
| Alternative Mode | Avg. Energy Use (kWh/mile) | Max Speed (mph) | Upfront Cost Range | 5-Year Ownership Cost | Key Safety Standard |
|---|---|---|---|---|---|
| Class 1 E-Bike | 0.015 | 20 | $1,299–$5,499 | $3,120–$8,900 | UL 2849 |
| Electric Scooter (Shared) | 0.022 | 15.5 | $0 (pay-per-use) | $1,200–$2,600 | UL 2272 |
| Electric Bus (Proterra) | 1.20 | 65 | $750,000–$850,000 | $1.8M–$2.1M | FRA 49 CFR Part 238 |
| EV Car (Tesla Model 3) | 0.27 | 140 | $40,240–$53,240 | $60,910–$72,450 | FMVSS 305 |
| Walking | 0.025 | 4 | $0 | $0 | N/A |
These figures reflect real equipment, tested standards, and verifiable economics—not projections. They demonstrate that alternatives are not compromises but optimized solutions for specific trip purposes: e-bikes for <5-mile commutes, scooters for first/last-mile gaps, buses for high-density corridors, and walking for hyperlocal needs. Each reduces electrical demand on aging infrastructure while improving public health outcomes—lower BMI rates, reduced hypertension incidence, and improved air quality metrics (PM2.5 reductions of 12–18 µg/m³ in Barcelona’s superblocks, per ISGlobal 2023 study).
Electrical safety remains foundational. Every alternative discussed here relies on standardized, code-compliant components: UL-listed chargers, NEC-compliant branch circuits, and IEEE-certified battery systems. There is no ‘shortcut’ to safety—only adherence to tested protocols. That discipline enables reliability, longevity, and user trust.
Adoption isn’t about eliminating cars entirely—it’s about matching the right tool to the right trip. A family with two school-aged children may use an EV for soccer practice 12 miles away, an e-bike for parent-teacher conferences 2 miles away, and walking for library visits 0.3 miles away. This multimodal approach cuts household transport costs by 52% (UC Davis ITS study, 2022) and reduces grid strain during peak hours.
Manufacturers continue lowering barriers. Rad Power offers $1,200 federal tax credits via IRS Form 8936 for qualifying e-bikes purchased in 2024–2032. Similarly, the Inflation Reduction Act extends the 30C EV tax credit to used EVs ($4,000) and adds a point-of-sale rebate for income-qualified buyers purchasing new EVs ($7,500) or e-bikes ($900). These incentives align with electrical best practices—no rebate requires rewiring your home; all qualify under existing NEC allowances.
Ultimately, sustainable mobility is an electrical system challenge as much as a transportation one. It demands precise load calculations, robust grounding, harmonized communication protocols, and rigorous component certification. When engineers, policymakers, and users collaborate around these fundamentals, alternatives stop being ‘alternatives’ and become the default—efficient, safe, and economically rational choices for daily life.
- UL 2849 certification is mandatory for e-bike electrical systems sold in the U.S. after January 2024.
- A 200W solar array (e.g., Renogy 200W Monocrystalline) can fully recharge a 672 Wh e-bike battery in 4.5 sun-hours—ideal for detached garages without grid access.
- NEC Article 625.42 requires GFCI protection for all EVSE outlets within 25 feet of a dwelling unit’s interior—applicable to garage-mounted e-bike chargers if located in wet locations.
- The average U.S. commute is 16.2 miles (U.S. Census Bureau, 2022), placing 68% of trips within feasible e-bike range (assuming 20–45 mile battery capacity and moderate terrain).
- IEEE 1547-2018 governs interconnection of distributed energy resources—including bidirectional e-bike chargers capable of vehicle-to-grid (V2G) export, though commercial V2G e-bike systems remain in pilot phase (e.g., Nuvve trials in Utrecht, Netherlands).
- Verify local zoning allows accessory dwelling units (ADUs) or home offices—reducing commute need at the source.
- Assess your home’s electrical panel: 100A minimum recommended for adding EV or e-bike charging alongside other loads.
- Confirm e-bike battery chemistry: LFP cells (e.g., in RadRunner 2) offer 3,000+ cycles vs. NMC (e.g., Specialized Turbo) at 1,000–1,500 cycles—critical for long-term ROI.
- Use conduit fill tables (NEC Chapter 9, Table 1) when installing shared e-bike charging hubs: Four 12 AWG THHN wires in ¾” EMT = 31% fill—within 40% limit for >2 wires.
- Require UL 1699B arc-fault protection on all circuits powering shared mobility charging stations—mandatory for commercial installations per NEC 210.12(A).