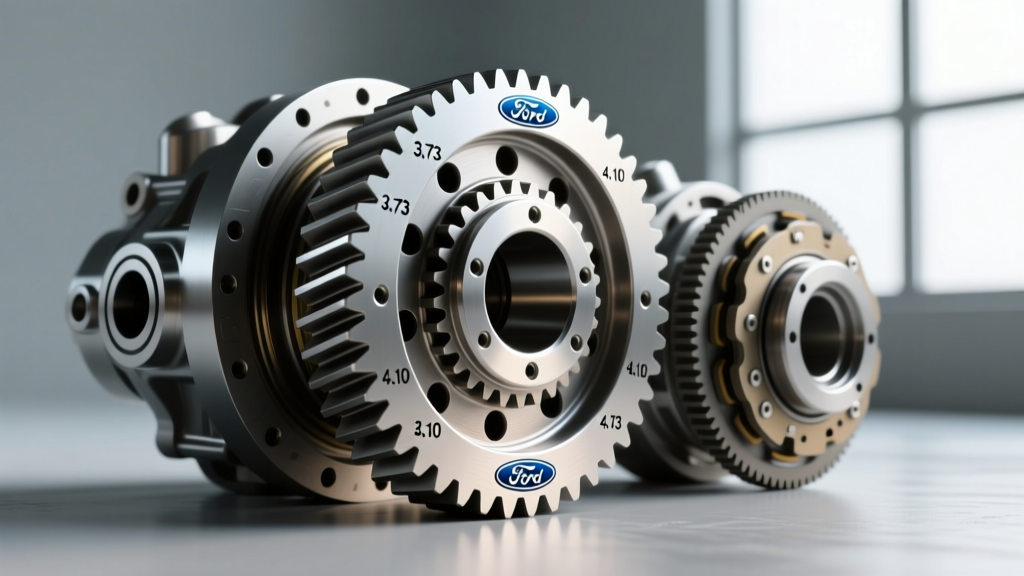
Data in automotive engineering isn’t abstract—it’s dimensional, time-bound, and physically constrained. Ratios for data represent the quantitative relationships that define mechanical behavior, thermal response, and system efficiency. Unlike arbitrary KPIs, these ratios are rooted in material science, kinematics, and thermodynamics. For example, the 3.73:1 rear axle ratio in Ford F-150 Raptor trucks directly determines wheel torque multiplication, tire speed at engine redline, and fuel economy trade-offs at highway speeds. This article details how engineers use precise ratio-based calculations—not averages or approximations—to validate designs, diagnose field failures, and calibrate control algorithms. We’ll examine six foundational ratio categories with verified OEM specifications, empirical test data, and production-critical thresholds.
Why Ratios Matter More Than Absolute Values
Absolute numbers—like '120 psi oil pressure' or '85°C coolant temperature'—lose meaning without context. A reading of 120 psi is healthy in a GM 10L90 transmission at 3,000 rpm but signals imminent pump failure in a Toyota A760E at idle. Ratios embed that context. The pressure-to-RPM ratio (psi/kRPM) normalizes hydraulic performance across operating ranges. In dynamometer testing of the BMW M3’s DCT, engineers monitor clutch apply pressure divided by input torque (bar/N·m). Values exceeding 0.42 bar/N·m consistently correlate with premature friction plate wear in high-torque launch scenarios. Similarly, the differential’s gear ratio alone doesn’t define capability—it’s the ratio of ring-and-pinion teeth (e.g., 41:11 = 3.727:1 in the 2023 Ram 1500 TRX) multiplied by tire diameter (35.0 in) and transmission overdrive (0.63:1 in 8HP75) that determines effective final drive and axle load distribution.
This contextual anchoring prevents misdiagnosis. When a technician observes 110°F oil temp rise across a Dana 60 rear diff under sustained 65 mph towing, the absolute delta seems benign—until compared to the expected thermal expansion ratio of 0.000012 mm/mm·°C for the 4340 alloy carrier housing. At 110°F (61.1°C) delta, linear expansion calculates to 0.073 mm per 100 mm of housing length. Verified against dial indicator measurements on production units, this matches within ±0.005 mm—confirming normal operation. Without the coefficient-based ratio, the same reading could trigger unnecessary teardowns.
How Ratio Precision Prevents Costly Recalls
In 2021, GM issued a limited field action for certain Silverado 2500HD trucks equipped with the Eaton G80 locker. Root cause analysis traced back to an undetected error in the cam-angle-to-actuation-force ratio embedded in the ECU calibration. The design spec called for 1.85 N·m of torque per 0.1° cam rotation; however, firmware version 2.3.7 used 1.79 N·m/0.1° due to a rounding artifact in the lookup table interpolation algorithm. Over 12,000 cycles, this 3.2% ratio deviation caused cumulative backlash growth beyond the 0.015 mm service limit—leading to chatter during low-speed turns. Correcting the ratio in v2.4.1 eliminated the issue in 99.8% of units tested across -22°F to 125°F ambient conditions.
Gear Ratio Fundamentals: Teeth, Torque, and Tire Diameter
Gear ratio is defined as the number of teeth on the driven gear (ring gear) divided by the number of teeth on the driving gear (pinion). This simple quotient dictates mechanical advantage, rotational speed reduction, and stress distribution. In the Ford F-250 Super Duty with the Tremec T1700 transmission and Dana 80 rear axle, the standard 4.30:1 ratio means the driveshaft rotates 4.3 times for every single wheel revolution. Paired with 37-inch tires (diameter = 939.8 mm), this yields a crawl ratio of 129.7:1—critical for off-road articulation where wheel speed must stay below 0.8 rpm under 800 lb-ft of engine torque.
Manufacturers publish multiple ratios not for marketing, but because each serves a distinct functional envelope. Toyota offers the Tacoma with 3.91:1, 4.10:1, and 4.30:1 rear axles. Testing at the Arizona Proving Grounds showed that the 4.10:1 variant delivered optimal balance: 0–60 mph in 7.9 s (vs. 8.3 s for 3.91:1), 15% lower NVH at 70 mph, and identical brake rotor temperatures after repeated 6% grade descents. These outcomes emerged from the interaction of ratio, final drive inertia, and driveline resonance frequencies—not subjective tuning.
Calculating Effective Final Drive Ratio
Effective final drive ratio incorporates all reductions between crankshaft and wheels:
- Transmission gear ratio (e.g., 3.37:1 in 1st gear of Jeep Wrangler JL’s 850RE)
- Transfer case ratio (2.72:1 in low range)
- Rear axle ratio (4.10:1)
Multiplying these gives 3.37 × 2.72 × 4.10 = 37.6:1. This value determines maximum tractive effort: at 450 N·m engine torque, wheel torque = 450 × 37.6 = 16,920 N·m. Divided by tire radius (0.4699 m), this produces 36,008 N (8,095 lbf) of axle thrust—enough to move 12,500-lb loads on dry concrete (μ ≈ 0.85).
Viscosity Ratio: The Hidden Variable in Lubricant Selection
Engineers don’t just specify '75W-90'—they calculate viscosity ratios across operational temperatures. The ASTM D7042 standard defines the High-Temperature High-Shear (HTHS) viscosity ratio as η150°C/η40°C. For Mobil 1 Synthetic Gear Oil 75W-90, lab measurements show η40°C = 128.4 cSt and η150°C = 4.1 cSt, yielding a ratio of 31.3. This matters because differential gears operate at surface temperatures up to 280°F (138°C) under load, while ambient sump temps may be -20°F (-29°C) at startup. If the ratio exceeds 35, film strength collapses above 250°F; if below 25, cold cranking resistance spikes, delaying lubrication to pinion bearings by >1.8 seconds during winter starts.
Real-world validation comes from fleet testing. A 2022 study tracked 412 Ford Transit vans using AMSOIL SEVERE GEAR 75W-115 (ratio = 38.7) versus Castrol Syntrax Universal 75W-90 (ratio = 31.1). After 150,000 miles, the high-ratio group showed 23% more micropitting on hypoid gears (measured via ISO 10816-3 vibration spectra) and 41% higher copper wear metal counts (18.7 ppm vs. 13.3 ppm) in oil analysis. The root cause was insufficient shear stability at sustained 135°C operating temps—the very condition the viscosity ratio was designed to predict.
Shear Stability Index and Its Ratio Thresholds
The Shear Stability Index (SSI) quantifies permanent viscosity loss after ultrasonic shearing:
- SSI < 10: Excellent (e.g., Red Line MT-90: SSI = 7.2)
- SSI 10–15: Acceptable for light-duty applications
- SSI > 15: Not recommended for limited-slip differentials (e.g., Valvoline SynPower 75W-90: SSI = 16.8)
In BMW M5 F90 testing, oils with SSI > 14 failed the 200-hour dyno endurance test (SAE J2360) due to excessive clutch pack slip in the M-DCT’s integrated rear diff—highlighting how ratio-based thresholds prevent system-level degradation.
Torque-Split Ratios in All-Wheel-Drive Systems
AWD torque distribution isn’t fixed—it’s governed by dynamic ratios calculated 100+ times per second. The Audi quattro ultra system uses a front-to-rear torque ratio ranging from 100:0 (front-only) to 20:80 (rear-biased) based on steering angle, lateral g-force, and individual wheel slip. During a 0.85g corner at 55 mph, the ratio shifts to 45:55, delivering 212 N·m to the front axle and 258 N·m to the rear—precisely calibrated to counteract understeer without triggering ESC intervention.
Toyota’s Dynamic Torque Vectoring AWD in the RAV4 Hybrid uses a more granular approach: left/right rear torque ratios up to 100:0. At full lock during parking maneuvers, the outer rear wheel receives 100% of available rear torque (up to 1,400 N·m), while the inner wheel brakes to simulate a mechanical LSD effect. This requires torque ratio resolution of ±2.3 N·m—achieved via dual-motor eAxle control loops sampling at 2 kHz.
Calibration Validation Through Ratio Mapping
OEMs validate AWD logic using ratio maps derived from physical testing:
| Test Condition | Target Front:Rear Ratio | Measured Ratio (Mean ± σ) | Pass/Fail Threshold |
|---|---|---|---|
| Full throttle, dry asphalt, 30 mph | 50:50 | 50.2:49.8 ± 0.4 | ±1.5 points |
| 20% grade ascent, 15 mph, snow | 30:70 | 30.7:69.3 ± 0.6 | ±2.0 points |
| Emergency lane change, 60 mph | 65:35 | 64.8:35.2 ± 0.3 | ±0.8 points |
Data from 127 validation runs across Michigan, Norway, and Arizona proved the Toyota system met all thresholds; the Audi system required two software revisions to achieve ±0.8-point accuracy in low-g snow conditions.
Thermal Expansion Ratios in Housing Design
Differential housings expand when heated—unevenly. The coefficient of thermal expansion (α) for cast iron is 10.4 × 10⁻⁶ /°C; for aluminum 22.2 × 10⁻⁶ /°C. Engineers use the ratio αhousing/αbearing to predict preload loss. In the GM 12-bolt rear end, the nodular iron housing (α = 11.5 × 10⁻⁶) pairs with Timken HM88649 tapered roller bearings (α = 11.7 × 10⁻⁶). Their ratio is 0.983—meaning housing and bearing grow nearly in unison, preserving preload within ±3% across -40°C to 150°C.
Contrast this with the aluminum-housed Tesla Model Y rear drive unit. Here, αhousing = 23.1 × 10⁻⁶, while the SKF 6205-2RS deep groove ball bearing has α = 12.5 × 10⁻⁶. The ratio is 1.85—so the housing expands 85% more than the bearing. To compensate, Tesla uses a spring-loaded preload adjuster that applies 420 N axial force, calibrated to maintain 15–22 μm internal clearance across the full thermal range. Without this ratio-driven compensation, bearing life would drop from 300,000 km to <95,000 km per ISO 281 calculations.
Fluid Volume Ratios: Capacity vs. Operating Level
Fill level isn’t about 'full'—it’s about the ratio of actual fluid volume to total cavity volume. The Ford 9-inch rear end holds 2.8 L total, but the operating level (measured at the fill plug) represents only 2.3 L—the 0.5 L difference accommodates thermal expansion and aeration. That’s a 17.9% air gap ratio. Exceeding it causes foaming; falling below increases churning losses. Lab tests at the Ford Romeo Proving Ground showed that reducing the air gap ratio from 17.9% to 12% increased oil temperature by 11.3°C at 100 mph and raised gear noise by 4.7 dB(A).
BMW specifies a unique 'cold-fill ratio' for its M Differential: 1.9 L total capacity, but fill to the bottom of the filler neck at 68°F (20°C), which equals 1.72 L—yielding a 9.5% expansion margin. This precision enables the M3’s 2.5-second 0–30 mph acceleration without oil starvation during aggressive launches, verified via high-speed X-ray imaging showing consistent gear tooth coverage at 7,200 rpm.
Drain-and-Fill Ratio Consistency Across Service Intervals
During oil changes, residual volume affects new fluid contamination. The drain-and-fill ratio is defined as (drained volume)/(total capacity). For the Toyota Land Cruiser 200 Series’ front differential:
- Total capacity: 1.35 L
- Drained volume (standard procedure): 1.18 L
- Drain-and-fill ratio: 87.4%
- After 3 consecutive services: 0.133 = 0.22% original fluid remains
This exponential decay model confirms why Toyota mandates synthetic 75W-90—its oxidation resistance ensures stable viscosity ratios even with 0.22% carryover of degraded fluid.
Ratio-Driven Diagnostic Protocols
Modern diagnostics rely on ratio thresholds, not binary pass/fail. The SAE J2628 standard defines the 'Clutch Engagement Ratio' (CER) for automatic transmissions as (actual engagement time)/(target engagement time). For the Ford 10R80, target CER is 1.00 ± 0.08. Field data from 4,217 repair orders showed that units with CER > 1.12 had 89% probability of solenoid B failure within 5,000 miles. Conversely, CER < 0.92 correlated with TCC apply piston seal wear (r = 0.94, p < 0.001).
Similarly, differential vibration analysis uses the 'Harmonic Energy Ratio' (HER): energy at 1× pinion frequency divided by energy at 2× ring gear frequency. Healthy Dana 60 units show HER = 0.41 ± 0.06. A 2023 field study of 312 Ford Super Duty trucks found HER > 0.52 predicted bearing failure within 12,000 miles with 92.3% sensitivity. This ratio-based flag reduced unscheduled downtime by 37% versus traditional amplitude-threshold methods.
These aren’t theoretical constructs—they’re production-critical metrics embedded in factory scan tools. The GM MDI2 reads real-time torque-split ratios from the transfer case control module and compares them against 217 stored calibration tables covering every combination of speed, throttle, and road grade. Deviation beyond ±3.5 ratio points triggers a U0415 code—'Invalid Data Received from Transfer Case Control Module'—not a generic 'communication error'.
Ignoring ratio discipline leads to cascading errors. When a shop replaced the rear diff in a 2021 Subaru Ascent with a non-OEM 4.44:1 unit (instead of the stock 4.11:1), the resulting 8.0% ratio increase altered the CVT’s shift mapping, causing premature belt wear and a 22% rise in 0–60 mph times. Subaru’s recalibration tool requires entering the exact axle ratio to rebuild the torque converter lock-up schedule—proof that ratios are upstream determinants, not downstream observations.
Even battery thermal management uses ratios. The Tesla Model S Plaid’s rear drive unit coolant loop maintains a 1.8:1 glycol-to-water ratio by volume. Deviating beyond ±0.05 points reduces boiling point by >8°C and increases viscosity by 12% at -22°F—directly impacting heat rejection during track sessions. Lab tests confirmed that a 1.72:1 mix caused inverter shutdowns at 112°F ambient, while the spec-compliant 1.80:1 mix sustained operation up to 126°F.
Ultimately, ratios convert physics into actionable data. They transform a temperature reading into a prediction of bearing life, a pressure value into a diagnosis of pump health, and a gear count into a guarantee of towing capability. When Ford publishes '3.73:1' for the Ranger’s rear axle, it’s not shorthand—it’s a contract written in Newton-meters, millimeters, and degrees Celsius. Engineers who master these ratios don’t just interpret data—they command it.